
|
Antares charts |
|
Very Large scale wgs 84 electronic charts |


|
NOTE: This website and material obtained from it are the copyright of Antares Charts © and may not be reproduced in whole or in part without express consent; use of all such material is subject to the disclaimers and conditions posted on this website and which may be changed at any time. For full Conditions Tap here.
|
|
Making the charts |
|
The survey
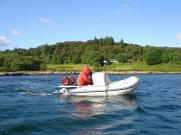
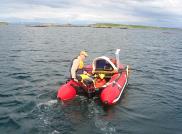
All our charts have been compiled from our own surveys. Surveying is an art and not a precise science. None of those involved in the surveys have relevant qualifications and no warranty is offered as to accuracy or completeness. To enable you to decide whether you wish to use the charts we have set out the general approach taken, although do not guarantee that it was followed precisely in every case. Surveys are made by criss-crossing an area in an inflatable boat equipped with an accurate gps (+/- 2m), depth sounder and data logger. Soundings are fed into surveying software, reduced to chart datum by deducting the height of the tide and then plotted to make the chart.
Issues affecting accuracy and completenessThere are many of these and this section sets out only some of the more important ones. Coverage of the area: while the depth sounder takes several soundings per metre in the direction of travel, the inflatable boat covers the area, initially, in straight lines that will be at least 10m apart and may be much more, depending on the expected nature of the sea bed. A large rock of say 5m across could easily fall between the lines and not be recorded. To guard against this the area is covered a second time with ‘side scan’ sonar that produces an ultrasound image looking out either side of the boat. These images require interpretation, which is a difficult and skilled process leaving a possibility of missing significant hazards. This is by far the most important risk involved with the making of the charts. Other risks include: Sounding reductions: The height of the tide above one or more fixed points at the survey site is logged continuously throughout all surveys. The level of chart datum is established principally by reference to predicted and observed heights at that location and to predicted and observed heights at nearby official tide gauges over the duration of the survey. Soundings are reduced by the observed height of the tide above the established datum.
GPS accuracy and latency: the gps used has a rated accuracy of +/- 2m but there is a risk that occasionally it may exceed this. There are also small inaccuracies introduced through timing inconsistencies between the gps and depth sounder and by a smoothing process in the charting software. These are unlikely to be significant if users keep a healthy distance from hazards but great care should be exercised if using the charts to berth alongside a vertical rock face!
PresentationContours and colours: we use white and, generally, three shades of blue to indicate depth: there are colour bands for 0-1m, 1-2m, 2-5m and deeper than 5m. Drying areas are shown as green, except on our extremely large scale XL charts where there are additional bands for drying heights at 1m intervals. Contours are at 1m intervals for areas of 5m and shallower, then at 5m intervals. Very occasionally we have used a half metre contour where we feel it is helpful, for example to indicate the deepest part of a channel. Background: we present our survey data against a background of OS District View data, which we have modified by enchancing the HW line and colouring land and sea. This is not dissimilar to the appearance of UKHO charts and CCC Imray Sailing Direction plans, many of which are derived from our charts. OS District View is published at a nominal ‘mid-scale’. While the HW line is usually very accurate it is to be expected that other features may be displaced by 10m or more. You will often notice that drying rocks don’t always exactly match our survey—and that is after we have corrected some of the greater OS discrepancies. We only move OS data when we are quite sure of the accuracy of our own data, usually corroborated from other sources. In most cases of discrepancy we have left the OS data as it is and just occasionally it will be we who are wrong. So, in all cases of apparent discrepancy you should assume the worst and avoid! There is also an erratic relationship between OS LW lines (MLWS) and our contours for chart datum. The OS freely admits that its LW information is not very accurate and so you should not be surprised to see these lines criss-crossing. We have left them where we think they are helpful, particularly where they relate to areas we have not surveyed. Coverage: the charts cover only the areas we deem to be of interest for navigation and inadequately covered by existing charts. We have not re-surveyed deeper water approach areas well covered by charts you will already have. Format and zooming: the charts are raster and not vector. They are effectively geo-referenced images of a picture with the consequence that the soundings and text become larger or smaller as you zoom in or out. They are thus impossible to read at some levels of zoom but quite clear at others. More issuesDrawing the chart: the computer software draws the chart by creating a TIN model (Triangulated Irregular Network—ie between selected soundings). Where there is lots of data it uses a small triangle size and draws the contours with great precision. But where there is less data it will use a larger triangle size. We have to set the maximum side length for the triangles: if this is small there will be gaps in the charts but if big it will jump over features we had not surveyed, such as islands and peninsulas. Normally we mark these features but there is a small risk that it has jumped over something we had not recorded as a hazard....
Weed: Fortunately our depth sounder readings are generally unaffected by weed but our equipment cannot push through thick kelp and at times this restricts our coverage. The problem is particularly acute at low water but then we just have to return at high water. Occasionally it is too thick even at high water and so we leave the area blank. Most of these areas are not navigable in any sort of boat but that doesn’t stop us all being curious! We have not tried to mark these areas: you will just see a gap.
Bladderwrack weed contains air bubbles and that does affect our soundings but it generally doesn’t grow to any great length and generally only on drying rocks. If we have been misled at least we will be reporting less water than there really is... |
|
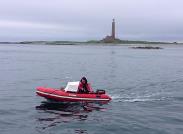
Below: acquiring the soundings |
|
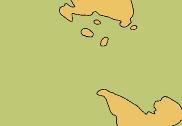
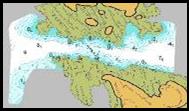
Building a chart |
|
Note: OS District View data is generally far less accurate than our data and you will notice cases of inconsistency. You should always assume the worst case and avoid anything that looks hard! |
|
OS District View with thickened HW line and coloured land and sea. |
|
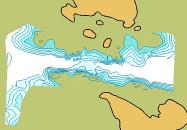
OS District View with our survey data added |
|
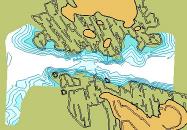
OS District View crags and rocks added |
|
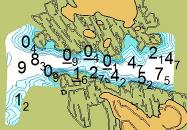
Soundings added |
|
Unsurveyed sea non-drying areas coloured grey |
|
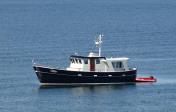
‘Otter’, base for surveying from 2014 |
|
HOME |
OUR CHARTS |
CORRECTIONS |
GUIDES & HELP |
CONTACT |
|
MAKING |
USING |
EXAMPLES |
LIST |
PIPELINE |